Genome-wide association study (GWAS) refers to study in which a genome-wide set of genetic variants (usually refers to single nucleotide polymorphisms, SNP) are genotyped and tested for association with a certain phenotype. In the past decade, numerous genetic loci have been identified to be associated with many complex traits (diseases) via GWAS both in humans (See National Human Genome Research Institute (NHGRI) Catalog of Published Genome-Wide Association Studies) and animals.
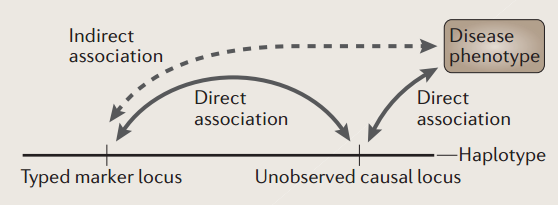
GWAS exploit linkage disequilibrium, which are population level associations between markers and causative mutations .
Accounting for population structure is more challenging when family structure or cryptic relatedness is present, and these limitations have motivated the development of new methods.
GEMMA is the software implementing the Genome-wide Efficient Mixed Model Association algorithm for a standard linear mixed model and some of its close relatives for genome-wide association studies (GWAS). It fits a univariate linear mixed model (LMM) for marker association tests with a single phenotype to account for population stratification and sample structure.
In the text, I used a set of published genomic data (Zhang et al.) to conduct a simple GWAS.
Quality control via Plink
1
2
plink --tfile sheep_new --chr-set 30 --allow-extra-chr --make-bed --out sheep
plink --bfile sheep --allow-extra-chr --chr-set 30 --geno 0.1 --hwe 0.0000001 --maf 0.05 --mind 0.1 --make-bed --out sheep_qcPopulation structure analysis via PCA
1
plink --bfile sheep_auto.prune --chr-set 30 --allow-extra-chr --pca
Association analysis
1
2
gemma -bfile sheep_auto -gk 1 -o sheep
gemma -bfile sheep_qc -k output/sheep.cXX.txt -lmm 4 -n 1 -o sheep_gemmaData Visualization in R package CMplot
CMplot is an excellent drawing tool designed for Manhattan plot of genomic analysis.
1 | #Manhattan plot and QQ plot |
- Result
